Umatilla County, Oregon | |
|---|---|
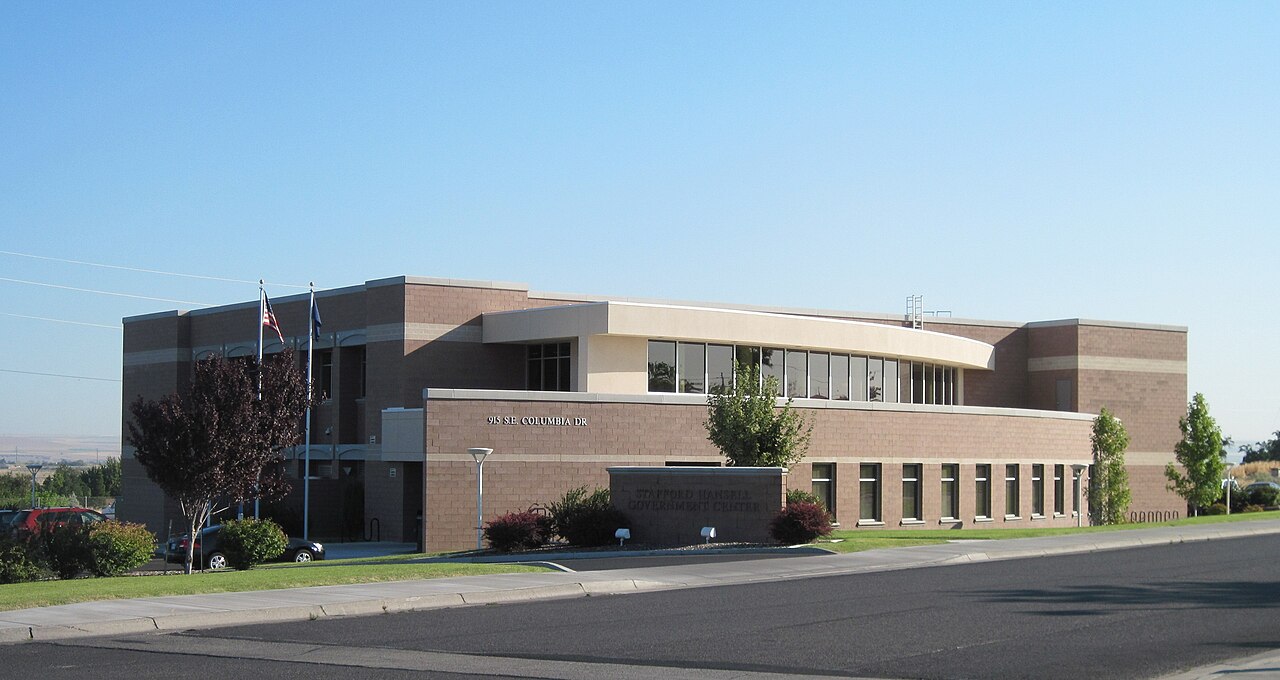 Stafford Hansell Government Center in Hermiston | |
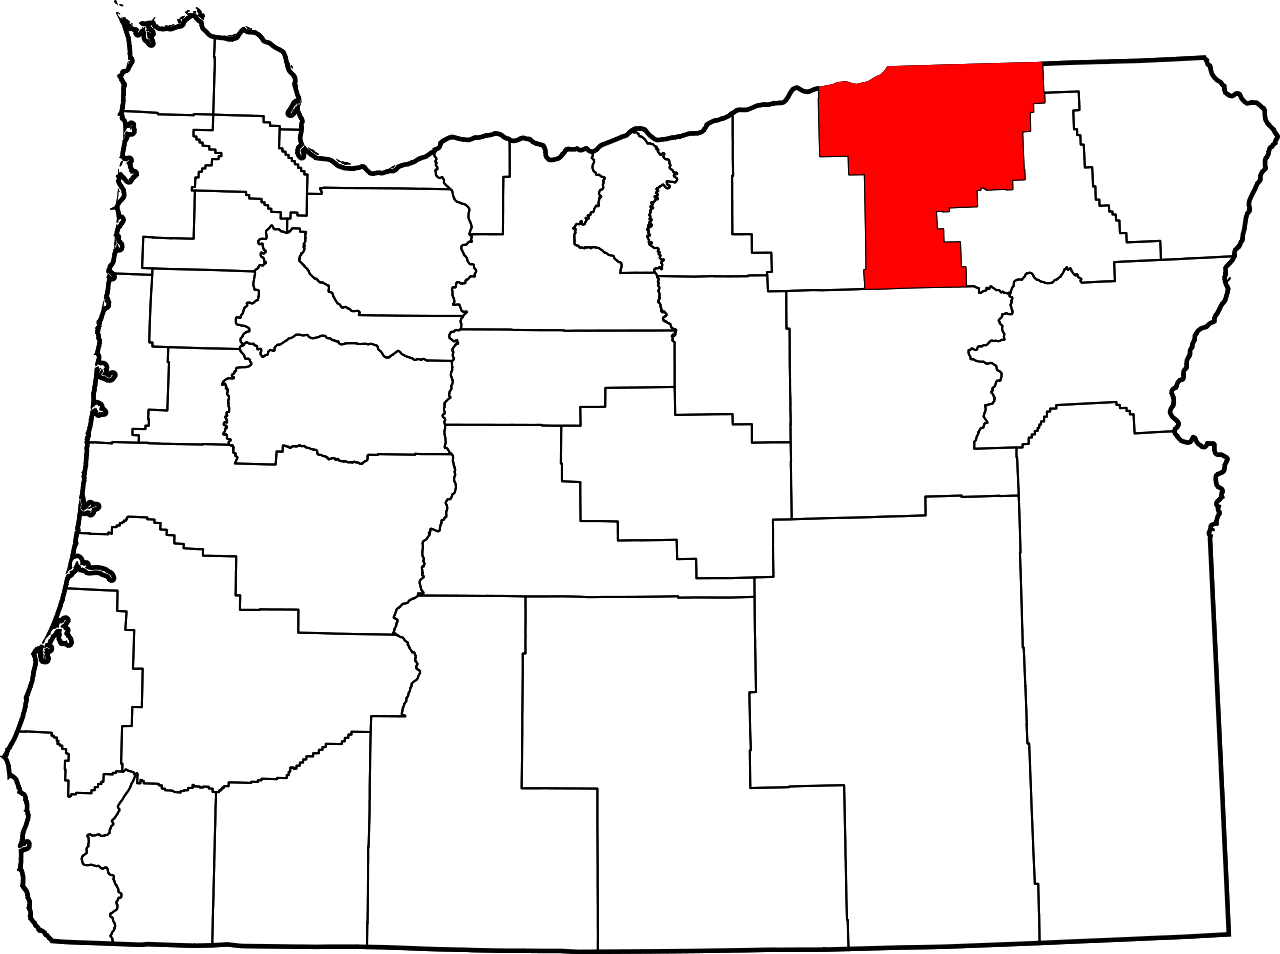 Location within the U.S. state of Oregon | |
| Coordinates: 45°22′30″N 118°45′05″W / 45.375131°N 118.7513661°W / 45.375131; -118.7513661 | |
| Country |  United States United States |
| State |  Oregon Oregon |
| Founded | September 27, 1862 |
| Named after | Umatilla River |
| Seat | Pendleton |
| Largest city | Hermiston |
| Area | |
• Total | 3,231 sq mi (8,370 km2) |
| • Land | 3,216 sq mi (8,330 km2) |
| • Water | 16 sq mi (41 km2) 0.5% |
| Population (2020) | |
• Total | 80,075 |
• Estimate (2024) | 80,491  |
| • Density | 23/sq mi (9/km2) |
| Time zone | UTC−8 (Pacific) |
| • Summer (DST) | UTC−7 (PDT) |
| Congressional district | 2nd |
| Website | www.co.umatilla.or.us |
Umatilla County (/ˌjuːməˈtɪlə/) is one of the 36 counties in the U.S. state of Oregon. The population of 81,826 ranks it as the 14th largest in Oregon, and largest in Eastern Oregon.[1] Hermiston is the largest and fastest growing city in Umatilla County, but Pendleton remains the county seat.[2] Umatilla County is part of the Hermiston-Pendleton, OR Micropolitan Statistical Area, which has a combined population of 94,833.[1] It is included in the eight-county definition of Eastern Oregon.
The county is named for the Umatilla River.
History
Umatilla County was created on September 27, 1862, out of a portion of Wasco County. Adjustments were made to the county's boundaries following the creation of Grant, Morrow, Union, and Wallowa Counties. This legislative act also designated Marshall Station as the temporary county seat. An 1865 election selected Umatilla City, now known as Umatilla, as the county seat. With the development of wheat farming, population shifted to the north and east parts of the county, and a subsequent election in 1868 moved the county seat again to Pendleton.
The Umatilla Indian Reservation was established by the Treaty of Walla Walla in 1855. The Umatillas, Walla Wallas, and Cayuse tribes were resettled there, and is located immediately southeast of Pendleton.
EZ Wireless of Hermiston officially opened on February 4, 2004, one of the largest known Wi-Fi wide area networks in the United States, covering parts of Umatilla County, Morrow County and Benton County, Washington. Although created to facilitate communications among local police, firemen and EMT workers who immediately respond to possible accidents or terrorist attacks on the Umatilla Chemical Depot, where the U.S. Army maintained a national arsenal of nerve gas, the network can be accessed in some places by the public for free.[3]
Geography

According to the United States Census Bureau, the county has a total area of 3,231 square miles (8,370 km2), of which 3,216 square miles (8,330 km2) are land and 16 square miles (41 km2) (0.5%) are covered by water.[4] It borders the Columbia River across from Washington.
Adjacent counties

- Benton County, Washington (north)
- Walla Walla County, Washington (north)
- Columbia County, Washington (northeast)
- Wallowa County (east)
- Union County (east)
- Grant County (south)
- Morrow County (west)
National protected areas
- Cold Springs National Wildlife Refuge
- McKay Creek National Wildlife Refuge
- Umatilla National Forest (part)
- Whitman National Forest (part)
Demographics
| Census | Pop. | Note | %± |
|---|---|---|---|
| 1870 | 2,916 | — | |
| 1880 | 9,607 | 229.5% | |
| 1890 | 13,381 | 39.3% | |
| 1900 | 18,049 | 34.9% | |
| 1910 | 20,309 | 12.5% | |
| 1920 | 25,946 | 27.8% | |
| 1930 | 24,399 | −6.0% | |
| 1940 | 26,030 | 6.7% | |
| 1950 | 41,703 | 60.2% | |
| 1960 | 44,352 | 6.4% | |
| 1970 | 44,923 | 1.3% | |
| 1980 | 58,861 | 31.0% | |
| 1990 | 59,249 | 0.7% | |
| 2000 | 70,548 | 19.1% | |
| 2010 | 75,889 | 7.6% | |
| 2020 | 80,075 | 5.5% | |
| 2024 (est.) | 80,491 | [5] | 0.5% |
| U.S. Decennial Census[6] 1790–1960[7] 1900–1990[8] 1990–2000[9] 2010–2020[1] | |||
2020 census
As of the 2020 census, the county had a population of 80,075. Of the residents, 24.6% were under the age of 18 and 16.6% were 65 years of age or older; the median age was 37.2 years. For every 100 females there were 107.6 males, and for every 100 females age 18 and over there were 109.1 males. 68.3% of residents lived in urban areas and 31.7% lived in rural areas.[10][11][12]
The racial makeup of the county was 66.8% White, 0.9% Black or African American, 3.8% American Indian and Alaska Native, 0.9% Asian, 0.2% Native Hawaiian and Pacific Islander, 15.6% from some other race, and 11.8% from two or more races. Hispanic or Latino residents of any race comprised 28.3% of the population.[12]
There were 28,372 households in the county, of which 34.5% had children under the age of 18 living with them and 25.2% had a female householder with no spouse or partner present. About 25.5% of all households were made up of individuals and 11.5% had someone living alone who was 65 years of age or older.[11]
There were 31,098 housing units, of which 8.8% were vacant. Among occupied housing units, 62.8% were owner-occupied and 37.2% were renter-occupied. The homeowner vacancy rate was 1.5% and the rental vacancy rate was 5.1%.[11]
| Race / Ethnicity (NH = Non-Hispanic) | Pop 1980[13] | Pop 1990[14] | Pop 2000[15] | Pop 2010[16] | Pop 2020[17] | % 1980 | % 1990 | % 2000 | % 2010 | % 2020 |
|---|---|---|---|---|---|---|---|---|---|---|
| White alone (NH) | 54,165 | 51,303 | 54,670 | 52,691 | 49,753 | 92.02% | 86.59% | 77.49% | 69.43% | 62.13% |
| Black or African American alone (NH) | 132 | 350 | 535 | 557 | 652 | 0.22% | 0.59% | 0.76% | 0.73% | 0.81% |
| Native American or Alaska Native alone (NH) | 1,500 | 1,746 | 2,258 | 2,383 | 2,571 | 2.55% | 2.95% | 3.20% | 3.14% | 3.21% |
| Asian alone (NH) | 331 | 503 | 518 | 626 | 685 | 0.56% | 0.85% | 0.73% | 0.82% | 0.86% |
| Native Hawaiian or Pacific Islander alone (NH) | x [18] | x [19] | 51 | 95 | 130 | x | x | 0.07% | 0.13% | 0.16% |
| Other race alone (NH) | 51 | 40 | 118 | 55 | 295 | 0.09% | 0.07% | 0.17% | 0.07% | 0.37% |
| Mixed race or Multiracial (NH) | x [20] | x [21] | 1,032 | 1,375 | 3,367 | x | x | 1.46% | 1.81% | 4.20% |
| Hispanic or Latino (any race) | 2,682 | 5,307 | 11,366 | 18,107 | 22,622 | 4.56% | 8.96% | 16.11% | 23.86% | 28.25% |
| Total | 58,861 | 59,249 | 70,548 | 75,889 | 80,075 | 100.00% | 100.00% | 100.00% | 100.00% | 100.00% |
2010 census
As of the 2010 census, 75,889 people, 26,904 households, and 18,647 families resided in the county.[22] The population density was 23.6 inhabitants per square mile (9.1/km2). The 29,693 housing units had an average density of 9.2 per square mile (3.6/km2).[23] The racial makeup of the county was 79.1% White, 3.5% American Indian, 0.9% Asian, 0.8% Black or African American, 0.1% Pacific islander, 12.5% from other races, and 3.1% from two or more races. Those of Hispanic or Latino origin made up 23.9% of the population.[22] In terms of ancestry, 21.4% were German, 12.8% were Irish, 11.6% were English, and 5.6% were American.[24]
Of the 26,904 households, 36.4% had children under the age of 18 living with them, 50.9% were married couples living together, 12.0% had a female householder with no husband present, 30.7% were non-families, and 24.7% of all households were made up of individuals. The average household size was 2.67 and the average family size was 3.17. The median age was 35.7 years.[22]
The median income for a household in the county was $45,861 and for a family was $53,585. Males had a median income of $39,288 versus $30,489 for females. The per capita income for the county was $20,035. About 11.0% of families and 15.8% of the population were below the poverty line, including 21.4% of those under age 18 and 9.5% of those age 65 or over.[25]
2021 US Census American Community Survey- Household Incomes
Strong economic growth in the west end of the county has propelled Hermiston well past Pendleton with the highest median household incomes in Umatilla County.
| Rank | City | Median Income | % Change from 2010 |
|---|---|---|---|
| 1 | Hermiston | $60,971 | +46.5% |
| 2 | Pendleton | $58,093 | +27.8% |
| 3 | Umatilla | $51,790 | +25.1% |
| 4 | Milton-Freewater | $48,250 | +43.3% |
Government and politics
State legislature
Umatilla County contains two Oregon State House Districts: State House District 57, which is currently represented by Greg Smith, and State House District 58, which is currently represented by Bobby Levy. Umatilla County is also located in the 29th District of the Oregon State Senate, represented by Todd Nash. Smith, Levy, and Nash are registered Republicans.
Board of commissioners
Umatilla County is represented and governed by three county commissioners. The Umatilla County Board of Commissioners is currently made up of Dan Dorran, John Shafer, and Cindy Timmons.[27]
Make-up of Umatilla County voters

Like all counties in eastern Oregon, the majority of registered voters who are part of a political party in Umatilla County are members of the Republican Party.[28] Registrations of Non-affiliated voters have increased significantly since Oregon began Automatic Voter Registration through the DMV in 2016.[29] Despite the increase in Non-affiliated voters, the Republican Party in Umatilla County has continued to see a 2:1 vote margin in Presidential elections between the years 2000 and 2024.
| Year | Republican | Democratic | Third party(ies) | |||
|---|---|---|---|---|---|---|
| № | % | № | % | № | % | |
| 1904 | 2,642 | 66.27% | 840 | 21.07% | 505 | 12.67% |
| 1908 | 2,328 | 55.67% | 1,568 | 37.49% | 286 | 6.84% |
| 1912 | 1,261 | 29.30% | 1,563 | 36.32% | 1,480 | 34.39% |
| 1916 | 3,664 | 42.33% | 4,606 | 53.22% | 385 | 4.45% |
| 1920 | 4,979 | 58.03% | 3,255 | 37.94% | 346 | 4.03% |
| 1924 | 3,854 | 44.71% | 3,052 | 35.41% | 1,714 | 19.88% |
| 1928 | 5,277 | 67.83% | 2,390 | 30.72% | 113 | 1.45% |
| 1932 | 2,930 | 33.01% | 5,631 | 63.43% | 316 | 3.56% |
| 1936 | 2,943 | 31.27% | 5,753 | 61.13% | 715 | 7.60% |
| 1940 | 5,193 | 51.11% | 4,935 | 48.57% | 32 | 0.31% |
| 1944 | 5,379 | 51.77% | 4,967 | 47.80% | 45 | 0.43% |
| 1948 | 5,726 | 48.69% | 5,891 | 50.09% | 144 | 1.22% |
| 1952 | 10,529 | 59.60% | 7,098 | 40.18% | 40 | 0.23% |
| 1956 | 9,654 | 55.70% | 7,678 | 44.30% | 0 | 0.00% |
| 1960 | 9,374 | 53.77% | 8,053 | 46.19% | 6 | 0.03% |
| 1964 | 6,138 | 36.41% | 10,689 | 63.40% | 32 | 0.19% |
| 1968 | 8,975 | 54.80% | 6,402 | 39.09% | 1,002 | 6.12% |
| 1972 | 10,470 | 57.94% | 6,090 | 33.70% | 1,511 | 8.36% |
| 1976 | 9,345 | 51.83% | 7,985 | 44.28% | 701 | 3.89% |
| 1980 | 12,950 | 57.78% | 7,382 | 32.93% | 2,082 | 9.29% |
| 1984 | 14,211 | 63.12% | 8,246 | 36.63% | 57 | 0.25% |
| 1988 | 10,254 | 54.02% | 8,327 | 43.87% | 400 | 2.11% |
| 1992 | 7,095 | 36.12% | 6,787 | 34.55% | 5,761 | 29.33% |
| 1996 | 9,703 | 45.14% | 8,774 | 40.82% | 3,018 | 14.04% |
| 2000 | 14,140 | 61.32% | 7,809 | 33.86% | 1,111 | 4.82% |
| 2004 | 17,068 | 64.84% | 8,884 | 33.75% | 370 | 1.41% |
| 2008 | 15,254 | 59.77% | 9,484 | 37.16% | 785 | 3.08% |
| 2012 | 15,499 | 62.07% | 8,584 | 34.38% | 886 | 3.55% |
| 2016 | 17,059 | 61.81% | 7,673 | 27.80% | 2,865 | 10.38% |
| 2020 | 21,270 | 64.38% | 10,707 | 32.41% | 1,061 | 3.21% |
| 2024 | 20,973 | 67.17% | 9,251 | 29.63% | 1,001 | 3.21% |
Economy
The gold rush of 1862 brought miners and stock raisers to the mountains and grasslands of Umatilla County. Another stimulus was the arrival of the railroad in 1881, opening the region to the development of dry-land wheat farming. Water for irrigation has been key to economic diversification and growth, most recently in the Hermiston area, where potatoes, onions, corn, and more than 200 other crops are grown commercially. Low-cost power through Umatilla Electric Cooperative and good freeway access are also driving growth in the Hermiston area, with amazon.com developing large data-center operations there, and major distribution facilities for Walmart, FedEx, UPS, and Meyer Distributing are all located in Hermiston.
The Greater Hermiston area, which encompasses the Hermiston, Umatilla, Stanfield, & Echo zip codes, and equates to a less than 10-minute commuting distance, has seen strong job growth since 2012. The Hermiston area added 2,930 jobs from 2012 to 2022, which equates to 91% of all net job growth in Umatilla County over that time.[31] More recently, Greater Hermiston accounted for 114% of Umatilla County job gains from 2019 to 2022 as a result of 1,121 jobs added compared to net losses of 74 and 48 jobs in Pendleton and Milton-Freewater respectively.[32]
Communities

_(umaDA0088).jpg)
_(umaDA0088).jpg/1280px-Steen_Road_Grain_Elevator_(Umatilla_County,_Oregon_scenic_images)_(umaDA0088).jpg)

Umatilla County is generally divided into three distinct economic and cultural areas, which are the West End, the Pendleton area, and the Milton-Freewater area. Although each of these communities shares some economic ties, the distance between each creates three very distinct communities. The West End includes the communities of Hermiston, Umatilla, Stanfield, and Echo. The Pendleton area includes Pendleton, Pilot Rock, Adams, and Athena. The Milton-Freewater area is largely tied to the Walla Walla, Washington area, and is considered a part of the Walla Walla Metropolitan Planning Organization. The similarities between the areas has created a long-standing rivalry, particularly between the West-End and the Pendleton-area, with regard to economic opportunity and public resources. The West End, led by Hermiston as its largest city, is now nearly twice the size of the Pendleton area, and is projected to be nearly three times the size of the Pendleton area by 2035.[34]
Cities
Census-designated places
Unincorporated communities
- Bingham Springs
- Blakeley
- Bucks Corners
- Cobb
- Cold Springs
- Cold Springs Junction
- Crockett
- Ferndale
- Gibbon
- Hidaway Springs
- Hinkle
- Holdman
- Lehman Springs
- McNary
- Myrick
- Nolin
- Nye
- Power City
- Rieth
- Sunnyside
- Tollgate
- Westland
Former communities
Education
School districts include:[35]
- Athena-Weston School District 29J
- Echo School District 5
- Helix School District 1
- Hermiston School District 8
- Milton-Freewater School District 7
- Pendleton School District 16
- Pilot Rock School District 2
- Stanfield School District 61
- Ukiah School District 80
- Umatilla School District 6
See also
References
- ^ a b c "Population Estimate Reports". Portland State University. December 18, 2023. Retrieved December 19, 2023.
- ^ "Find a County". National Association of Counties. Retrieved June 7, 2011.
- ^ "Wi-Fi Cloud Covers Rural Oregon". Wired News. CondéNet Inc. Associated Press. October 16, 2005. Retrieved December 10, 2006.
- ^ "2010 Census Gazetteer Files". United States Census Bureau. August 22, 2012. Retrieved February 28, 2015.
- ^ "County Population Totals and Components of Change: 2020-2024". United States Census Bureau. Retrieved May 15, 2025.
- ^ "U.S. Decennial Census". United States Census Bureau. Retrieved February 28, 2015.
- ^ "Historical Census Browser". University of Virginia Library. Retrieved February 28, 2015.
- ^ Forstall, Richard L., ed. (March 27, 1995). "Population of Counties by Decennial Census: 1900 to 1990". United States Census Bureau. Retrieved February 28, 2015.
- ^ "Census 2000 PHC-T-4. Ranking Tables for Counties: 1990 and 2000" (PDF). United States Census Bureau. April 2, 2001. Archived from the original (PDF) on February 26, 2015. Retrieved February 28, 2015.
- ^ "2020 Decennial Census Demographic and Housing Characteristics (DHC)". United States Census Bureau. 2023. Retrieved 10 December 2025.
- ^ a b c "2020 Decennial Census Demographic Profile (DP1)". United States Census Bureau. 2021. Retrieved 10 December 2025.
- ^ a b "2020 Decennial Census Redistricting Data (Public Law 94-171)". United States Census Bureau. 2021. Retrieved 10 December 2025.
- ^ "1980 Census of Population - General Population Characteristics - Oregon - Table 58 - Persons by Race and Table 59 - Total Persons and Spanish Origin Persons by Type of Spanish Origin and Race (p. 39/24-39/32)" (PDF). United States Census Bureau.
- ^ "1990 Census of Population - General Population Characteristics - Oregon - Table 5 - Race and Hispanic Origin" (PDF). United States Census Bureau. pp. 9–30.
- ^ "P004: Hispanic or Latino, and Not Hispanic or Latino by Race – 2000: DEC Summary File 1 – Umatilla County, Oregon". United States Census Bureau.
- ^ "P2: Hispanic or Latino, and Not Hispanic or Latino by Race – 2010: DEC Redistricting Data (PL 94-171) – Umatilla County, Oregon". United States Census Bureau.
- ^ "P2: Hispanic or Latino, and Not Hispanic or Latino by Race – 2020: DEC Redistricting Data (PL 94-171) – Umatilla County, Oregon". United States Census Bureau.
- ^ included in the Asian category in the 1980 Census
- ^ included in the Asian category in the 1990 Census
- ^ not an option in the 1980 Census
- ^ not an option in the 1990 Census
- ^ a b c "DP-1 Profile of General Population and Housing Characteristics: 2010 Demographic Profile Data". United States Census Bureau. Archived from the original on February 13, 2020. Retrieved February 23, 2016.
- ^ "Population, Housing Units, Area, and Density: 2010 - County". United States Census Bureau. Archived from the original on February 13, 2020. Retrieved February 23, 2016.
- ^ "DP02 SELECTED SOCIAL CHARACTERISTICS IN THE UNITED STATES – 2006-2010 American Community Survey 5-Year Estimates". United States Census Bureau. Archived from the original on February 13, 2020. Retrieved February 23, 2016.
- ^ "DP03 SELECTED ECONOMIC CHARACTERISTICS – 2006-2010 American Community Survey 5-Year Estimates". United States Census Bureau. Archived from the original on February 13, 2020. Retrieved February 23, 2016.
- ^ "QuickFacts- Hermiston City, Oregon; Pendleton City, Oregon; Umatilla City, Oregon; Milton-Freewater City, Oregon". United States Census Bureau. Retrieved February 15, 2023.
- ^ "Board of Commissioners". Umatilla County. Retrieved February 15, 2023.
- ^ "HP Records Manager WebDrawer - 2009 April Voter Registration". records.sos.state.or.us. Retrieved December 15, 2020.
- ^ "Study finds steep 66% drop in party registration with automatic voter registration". Phys.org. May 3, 2023. Retrieved January 31, 2024.
- ^ Leip, David. "Dave Leip's Atlas of U.S. Presidential Elections". uselectionatlas.org. Retrieved April 11, 2018.
- ^ LeCompte, By Michael (September 2, 2025). "Greater Hermiston area driving strong job growth in Umatilla, Morrow Counties". Northeast Oregon Now. Retrieved September 3, 2025.
- ^ Reports, Staff (September 1, 2025). "City of Hermiston: Greater Hermiston area adds 2,200 jobs 2012-22". Hermiston Herald. Retrieved September 3, 2025.
- ^ 1996 Portrait: Regional (northwest) Economic Review And Outlook. DIANE Publishing Company. 2004. p. 32. ISBN 0-7881-3093-5.
- ^ "Coordinated Population Forecast for Umatilla County, its Urban Growth Boundaries (UGB), and Area outside UGBs 2016-2066" (PDF). Archived from the original (PDF) on December 19, 2016. Retrieved December 24, 2016.
- ^ "2020 CENSUS - SCHOOL DISTRICT REFERENCE MAP: Umatilla County, OR" (PDF). United States Census Bureau. Archived (PDF) from the original on October 9, 2022. Retrieved July 17, 2022. - Text list
External links
- Umatilla County (official website)
45°22′30″N 118°45′05″W / 45.375131°N 118.7513661°W / 45.375131; -118.7513661
